
Health Analytics
"Employers, payers, providers, and plan holders across the US medical insurance industry operated with fragmented claims data and limited visibility into member risk, care gaps, and cost trends, leading to delayed claims processing, deferred care delivery, and poorly aligned benefit decisions."
70%
CARE GAPS SURFACED
Care gaps across 70% of members were identified for faster intervention by care teams.
60%
HIGH-RISK COST SPOTTED
Nearly 60% of the cost burden was linked to high risk members, enabling earlier targeted intervention.
4-5 Hours
DAILY PROCESSING ELIMINATED
Manual data processing time was eliminated across the data operations team through automated pipelines.
Challenges holding Health Analytics back
Healthcare organizations struggled with fragmented claims data, limited member risk visibility, delayed care gap identification, and manual claims processing across the insurance ecosystem.
The Challenges

01High-Risk Member Invisibility
Payers and employers could not identify high risk members early, limiting intervention, cost control, and resource allocation.

02Fragmented Multi-Source Data
Claims, census, and member data existed across disconnected sources, creating manual reconciliation effort and inconsistent planning data.

03Plan-Member Mismatch
Plan holders were assigned to plans without matching against health risk profiles, leading to unsuitable coverage and poor benefit utilization.
Challenges Impact
Risk
COST VISIBILITY
Planning
RESOURCE GAPS
Processing
MANUAL OVERHEAD
High Risk Cost Burden Going Unmanaged — Lack of early high risk member visibility increased preventable care costs for payers and employers.
Resource Planning Built on Guesswork — Lack of utilization data forced providers to rely on estimates for budget and capacity planning, leading to resource inefficiencies.
Manual Data Processing Consuming Staff Capacity — Teams spent four to five hours daily reconciling claims data manually, delaying planning and reporting decisions.
Employee Benefit Value Eroded by Poor Plan Fit — Members enrolled in unsuitable plans failed to receive the full value of employer funded benefits, increasing underutilized coverage risk.
Care Intervention Timing Too Late to Reduce Cost — High risk members were identified only after care episodes occurred, making interventions reactive instead of preventive.
Unified health analytics platform to streamline risk prediction, care gap intervention, and plan recommendations
A web based health analytics platform that processed claims data through automated pipelines and delivered insights for member risk, disease prediction, care gap identification, and PMPM cost tracking. Built on a HIPAA compliant, HL7 FHIR standardized foundation, the platform provided stakeholders with a structured real time view of population health and cost performance.
Solution

Gave employers and brokers segmented population views based on risk, disease stage, and cost intensity.

Predicted disease progression and chronic condition risk to support early intervention.

Identified care gaps and triggered customized intervention workflows through configurable rules.

Automated claims and census data pipelines to eliminate manual processing and deliver clean decision ready data.
Solution Highlights

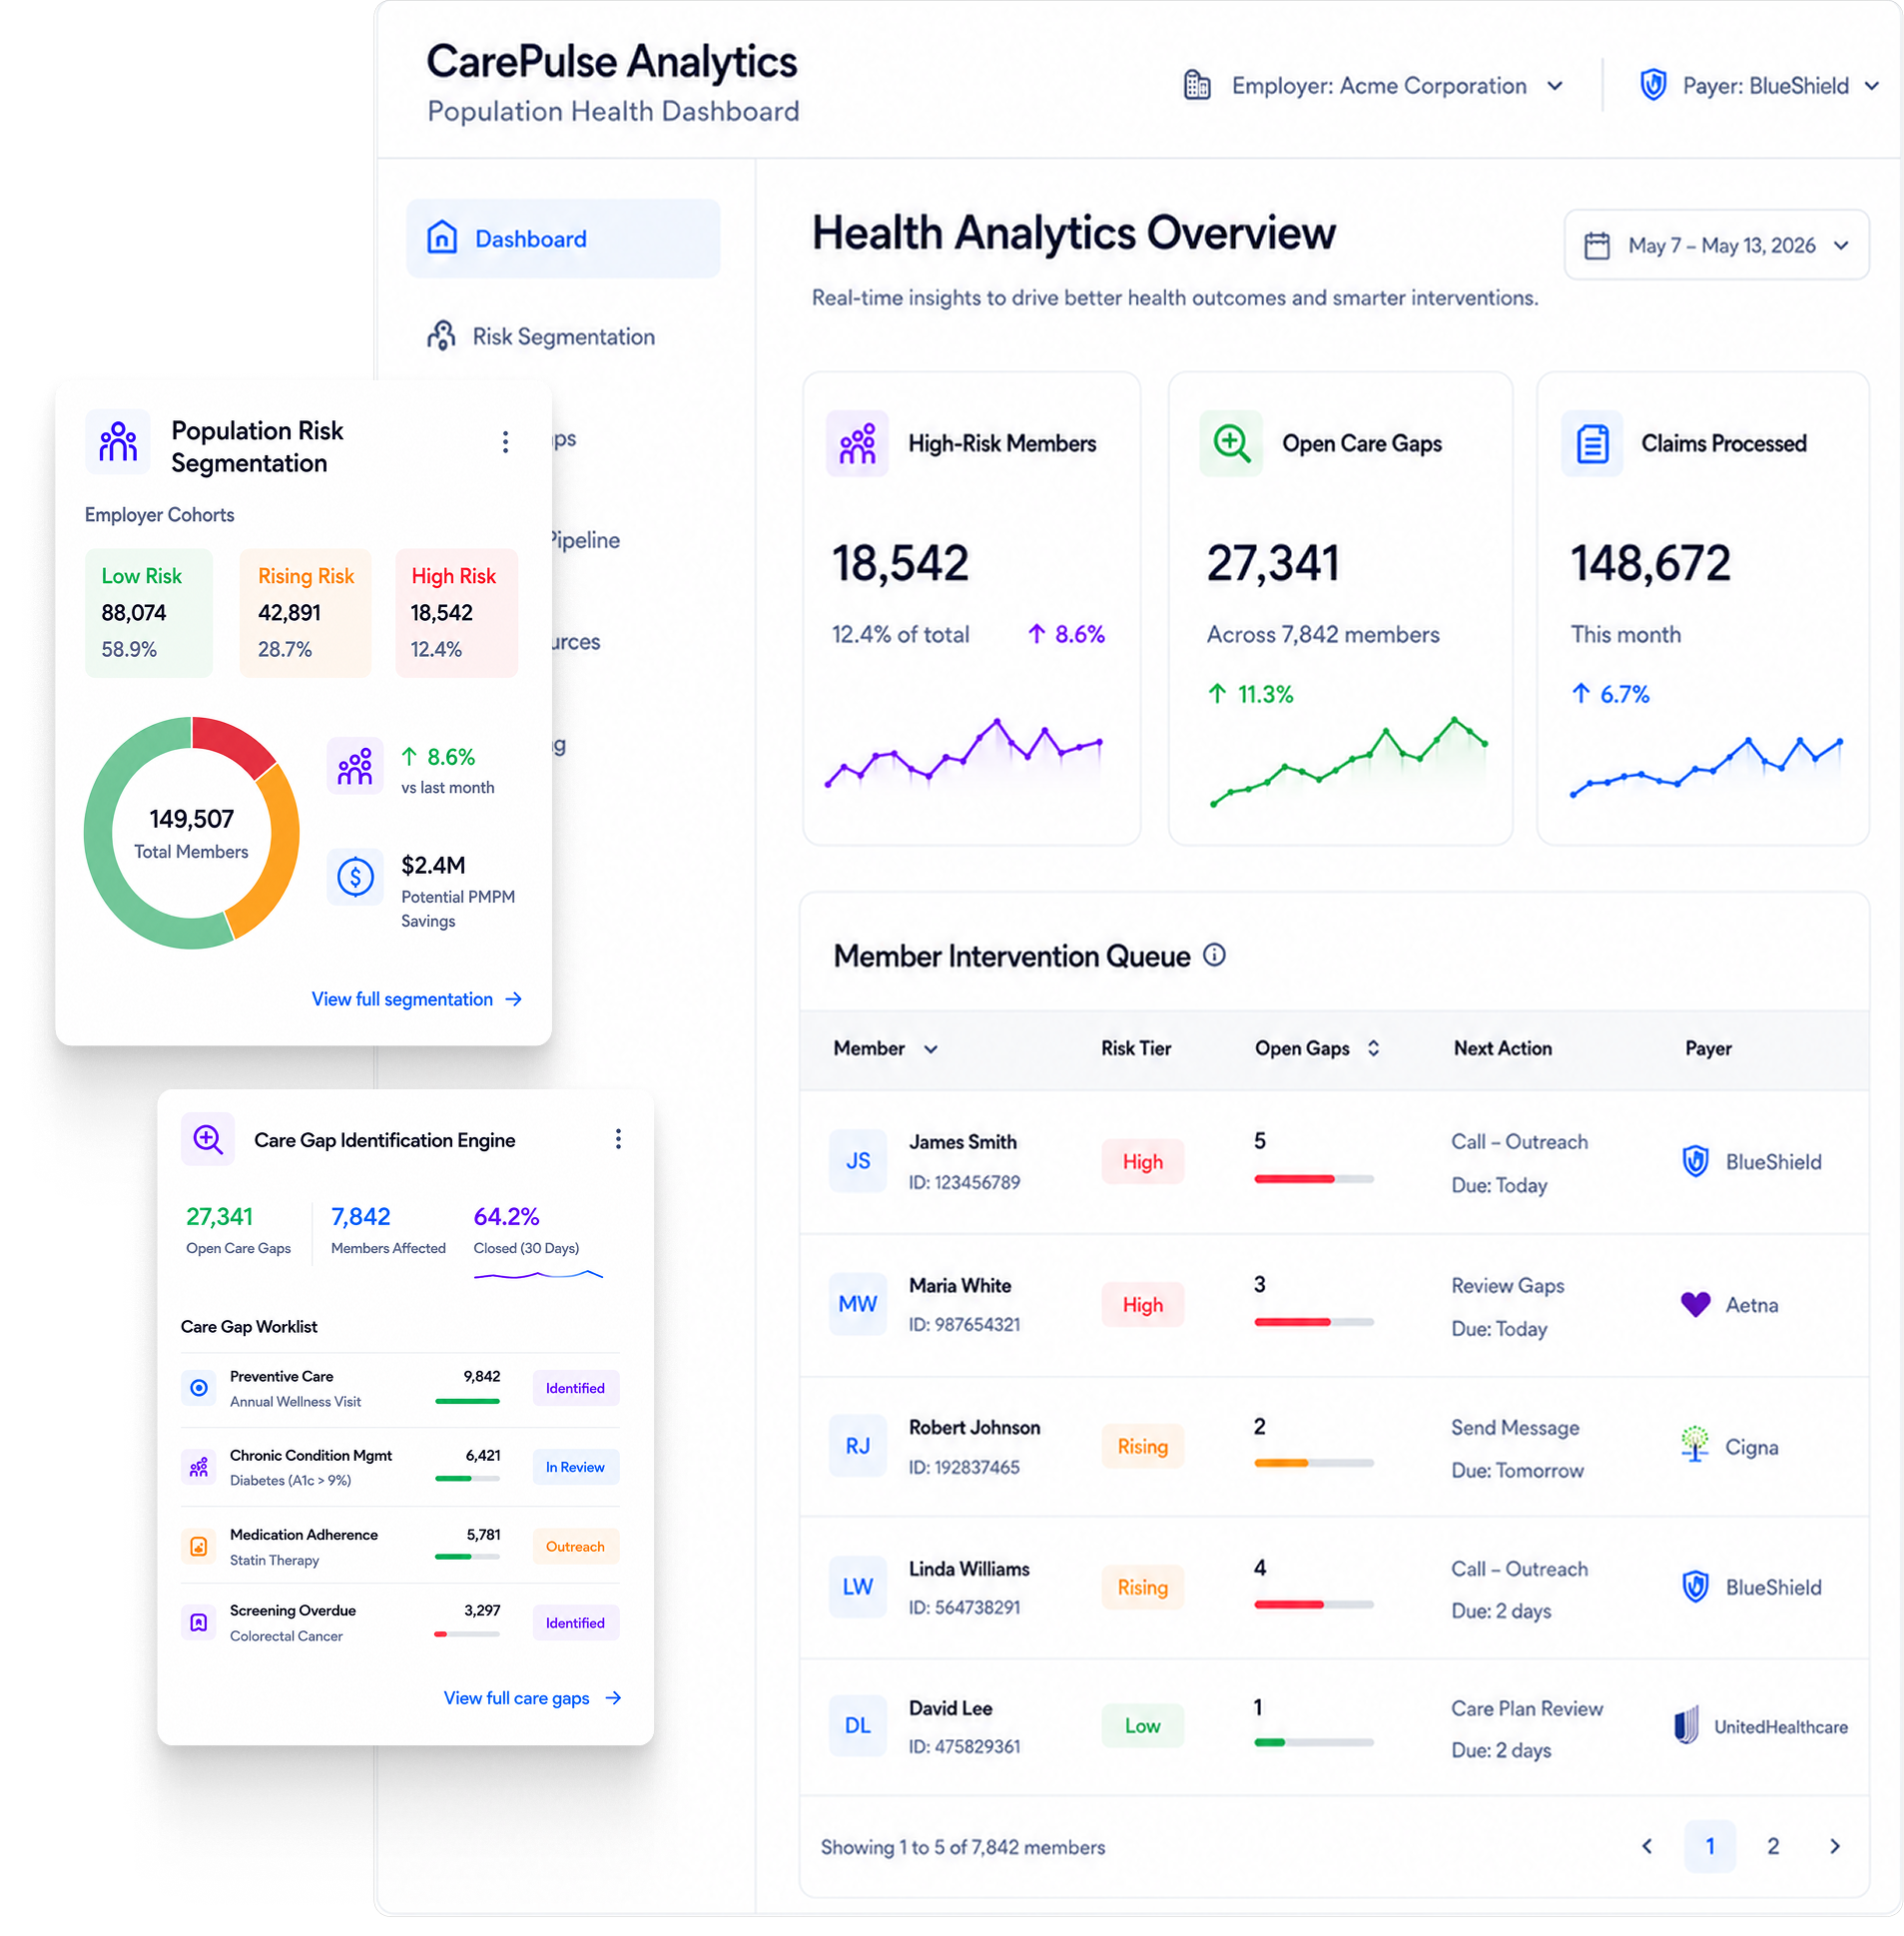
Population Risk Segmentation
Delivered employer dashboards segmenting members into risk cohorts based on multiple risk factors and cost exposure.

Chronic Condition Prediction
Predicted chronic condition progression and categorized members into risk intensity tiers for targeted intervention.

Care Gap Identification Engine
Identified care gaps and surfaced intervention opportunities through a customized rules engine before conditions advanced.

Health Risk Stratification
Stratified member risk by disease type, cost, and utilization to guide benefit spending toward high impact conditions.

Automated Claims Data Pipeline
Automated claims and census data processing into a structured data lake, eliminating manual processing effort.

HL7-FHIR and HIPAA Compliance Layer
Standardized data to HL7 FHIR format with HIPAA compliant secure exchange across employers, payers, providers, and administrators.
Tech Stack

Azure

Functions

Data Lake

Python

Spark

Data Factory

DataBricks

Elastic Search
Improving member risk visibility, care gap intervention, and claims data intelligence
The platform helped healthcare organizations move from fragmented claims processing and manual reconciliation to a structured health analytics ecosystem with faster risk identification, care gap tracking, and data driven decision making.
Key Outcomes

Defined PMPM Cost Baseline
Employers gained a reliable PMPM cost metric for benefit planning and year on year cost tracking.

Faster Care Gap Intervention
Care gaps across 70% of members were identified early, enabling faster intervention before conditions progressed.

High-Risk Cost Contained Early
Nearly 60% of high risk cost burden was identified early, enabling proactive intervention and claims reduction.

Eliminated Manual Processing Overhead
Automated claims and census pipelines recovered four to five daily processing hours per team.

Accurate Plan-Member Matching
Plan holders were matched to coverage aligned with their health risk profile, improving benefit utilization.

HIPAA-Compliant Data Foundation
Claims and member data were standardized to HL7 FHIR within a HIPAA HITRUST certified architecture for secure data exchange.
Features
Population Risk Segmentation
Chronic Condition Prediction
Care Gap Identification Engine
Health Risk Stratification
Automated Claims Data Pipeline
PMPM Cost Intelligence
HL7 FHIR and HIPAA Compliance Layer
Our Engineering
Marvels
That Drive
Digital Transformation
Discover how our technology solutions helped businesses improve operations, automate workflows, and achieve measurable outcomes.

Health SignOn
The company struggled to manage application access, user roles, data processing, and language requirements consistently across multiple geographies without increasing manual effort or data errors.

Intermodal Trucking Suite
Three compounding friction points slowed order movement, reduced operational visibility, and created delays across the supply chain.

Drug Analysis
Pharma teams struggled to track drug consumption, patient behavior, disease progression, and demand patterns accurately across the treatment lifecycle.

Insurance Operator
Claims friction, verification delays, and payer-clinic coordination gaps made it difficult for plan holders to use medical benefits smoothly within the registered clinic network.
Regimen Tracker
Oncology teams struggled with disconnected regimen tracking, unbalanced workloads, delayed lab coordination, and long patient wait times across the treatment journey.