
Payer Insights
"Payers struggled to assemble claims data, resulting in limited insights into network composition and leakages. These network leakages created cost burden and plan-holder churn within the payer network."
25%
RETENTION INCREASED
Plan holder retention improved through targeted plan matching and network insights.
12-15 hrs
DAILY TIME RECOVERED
Manual data processing time was eliminated daily across at least three data team members.
Leakage Visibility
LEAKAGE INSIGHTS
Clear referral and competitor visibility helped payers reduce leakage risk.
Challenges holding Payer Insights back
Healthcare payers struggled to consolidate claims, referral, utilization, and network data, limiting visibility into plan performance, risk, and network leakage.
The Challenges

01Network Composition Blindness
Payers lacked visibility into network composition, limiting provider optimization and plan performance analysis.

02Referral Leakage Gap
Disconnected payer and provider workflows allowed referrals to move out of network, increasing avoidable costs.

03High-Risk Member Inaction
Payers could not identify high risk members early, delaying preventive care and increasing higher cost claims.

04Manual Data Processing Gap
Claims data was manually assembled and transformed, delaying insights and adding daily processing effort.
Challenges Impact
Network
LEAKAGE
Risk
BLIND SPOTS
Processing
EFFORT
Uncontrolled Network Leakage Costs — Referrals flowing out of network without visibility created avoidable cost increases across thousands of claims.
Plan Holder Churn from Poor Fit — Without proper plan differentiation, payers struggled to align plan holders with the right coverage, resulting in dissatisfaction, lower retention, and renewal losses.
High Risk Claims Left Unmanaged — Members with chronic and high risk conditions progressed without early engagement, increasing emergency and acute care costs.
Manual Data Processing Overhead — Data teams spent four to five hours daily assembling and transforming claims data manually, delaying downstream decisions.
Competitive Network Exposure — Payers lacked visibility into competitor networks, weakening contracting decisions and increasing member migration risk.
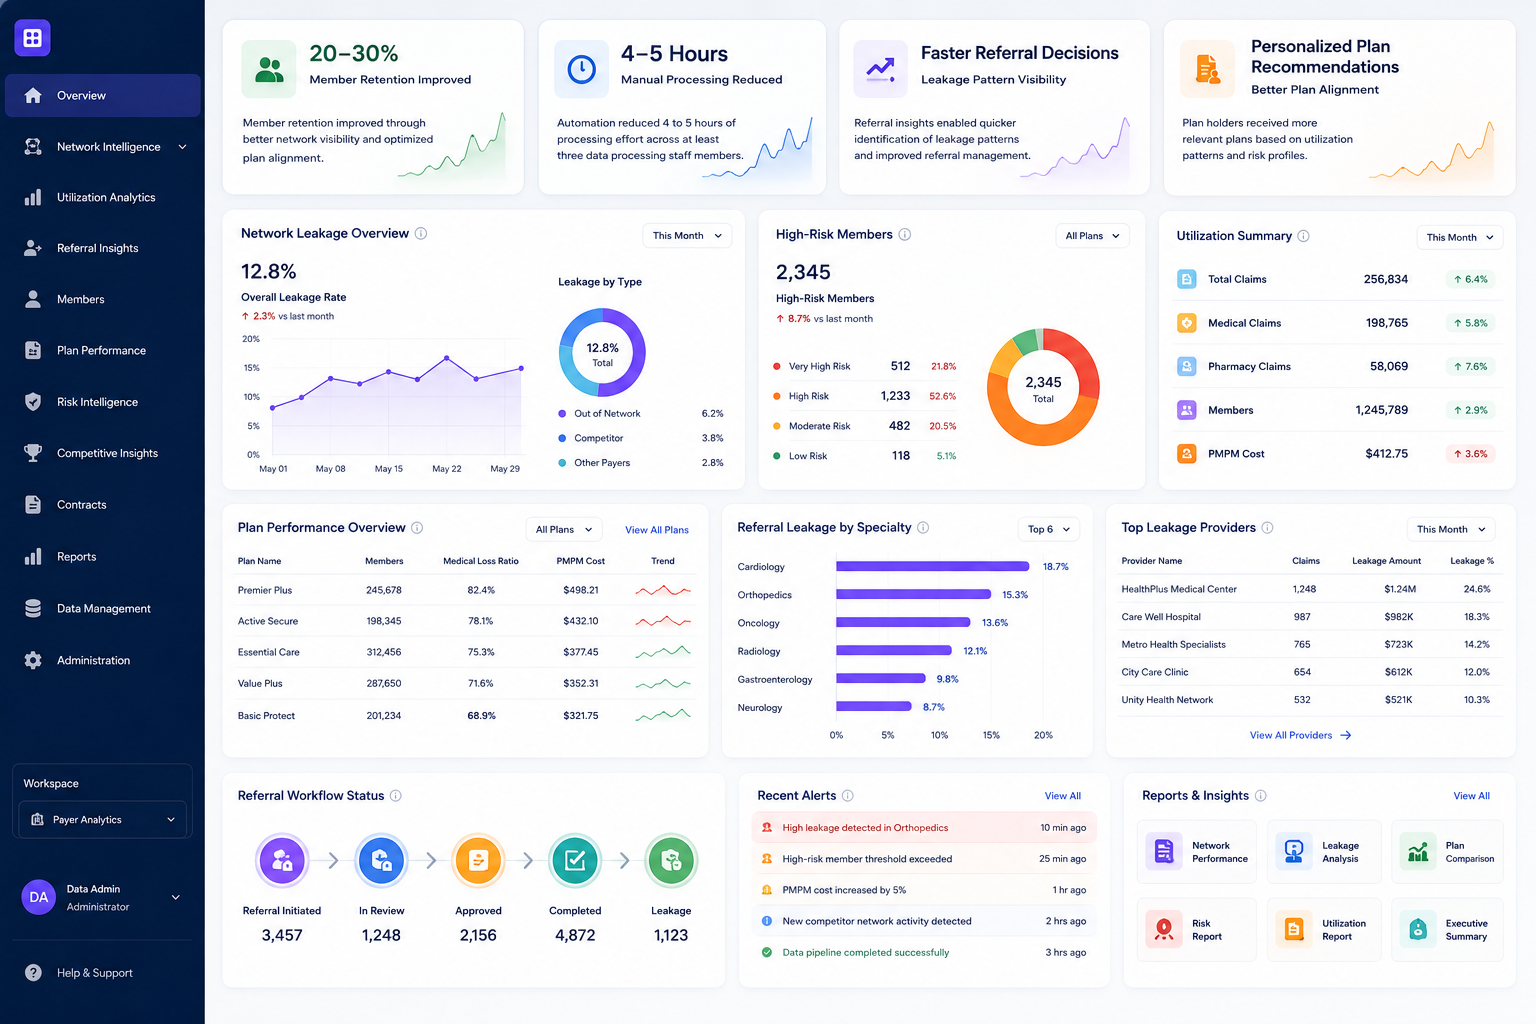
Web-based Payer intelligence platform to transform claims data into network and utilization insights
A web based analytical platform that processed large volumes of payer claims data and delivered insights across network composition, utilization, high risk member tracking, and competitive benchmarking through automated workflows and structured dashboards.
Solution

Gave payers clear network composition metrics and coverage insights at physician and geography level.

Connected payers, providers, and plan holders through integrated referral workflows to close out of network leakage.

Tracked and flagged high risk members automatically for early preventive engagement.

Delivered year on year and month on month comparisons for contracting decisions, forecasting, and budget planning.
Solution Highlights

Network Coverage Reporting
Delivered payer coverage and formulary insights with physician and geography level drill downs for better network visibility.

Referral Workflow Integration
Connected payer, provider, and plan holder operations through shared referral workflows to reduce out of network leakage.

High-Risk Member Tracking
Tracked high risk members in real time to enable early preventive care engagement.

Step Therapy Decision Support
Enabled faster contracting and plan design decisions through granular step therapy analysis.

Forecasting and Budget Comparisons
Generated year wise and month wise comparisons to support forecasting and budget planning.

Automated Claims Data Pipeline
Replaced manual claims processing with automated pipelines delivering clean structured data for analysis.
Tech Stack

Azure

Power BI

Functions

Data Lake

Blob Storage

Python

Spark

React
Improving payer network intelligence, referral visibility, and plan performance
The platform helped payers move from fragmented claims data to a centralized analytics environment with better network visibility, referral tracking, risk monitoring, and faster planning decisions.
Key Outcomes

Improved Plan Holder Retention
Retention improved by 25% through better coverage matching using network composition insights.

Eliminated Processing Overhead
Automated claims pipelines eliminated four to five hours of manual daily data processing per team.

Faster Referral Response
Payers responded to referral gaps faster through real time visibility into out of network patterns.

Personalized Plan Delivery
Plan holders received coverage aligned to their health profiles through member analytics insights.

Proactive Risk Management
High risk members were identified and engaged early to reduce emergency and acute care escalation.

Competitive Network Positioning
Competitive benchmarking visibility supported stronger contracting and plan design decisions.
Features
Claims Analytics
Network Intelligence
Referral Leakage Tracking
High-Risk Member Monitoring
Utilization Analytics
Forecasting Intelligence
Power BI Dashboards
Our Engineering
Marvels
That Drive
Digital Transformation
Discover how our technology solutions helped businesses improve operations, automate workflows, and achieve measurable outcomes.

Health Analytic
Healthcare organizations struggled with fragmented claims data, limited member risk visibility, delayed care gap identification, and manual claims processing across the insurance ecosystem.

Health SignOn
The company struggled to manage application access, user roles, data processing, and language requirements consistently across multiple geographies without increasing manual effort or data errors.

Intermodal Trucking Suite
Three compounding friction points slowed order movement, reduced operational visibility, and created delays across the supply chain.

Emergency Assistance
Patients struggled to access timely emergency support, while providers and payers lacked visibility into active incidents, care coordination, and response tracking.

Insurance Operator
Claims friction, verification delays, and payer-clinic coordination gaps made it difficult for plan holders to use medical benefits smoothly within the registered clinic network.